Digital Twins in Logistics 2025: 7 Ways to Slash Costs & Delays
Digital twins are gaining traction across supply chains because planning under variable demand, capacity, weather, and regulation is difficult. This article explains Digital Twins in Logistics from a clear, objective standpoint: what they are, how they work, where they add value, and how to start without overreach. The aim is practical understanding for planners, engineers, and managers who want evidence before investing.

What is a digital twin in logistics?
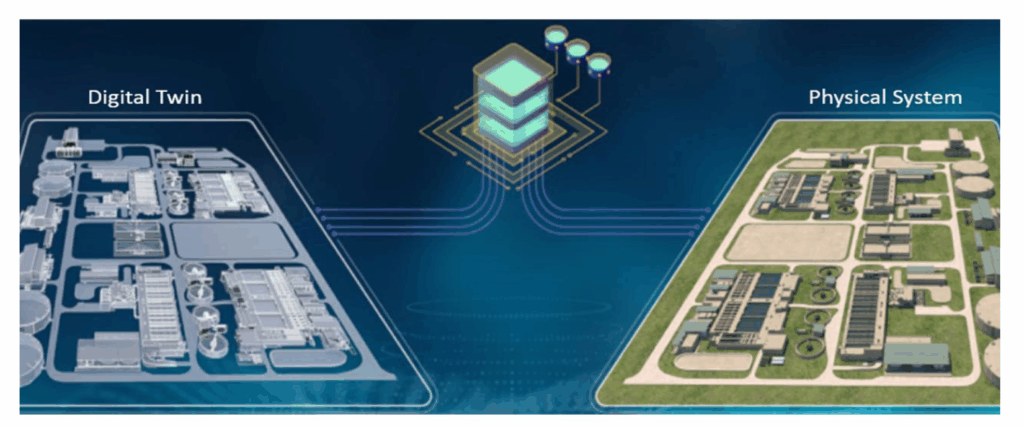
A digital twin is a data-driven model of a real system that stays current through frequent updates. In logistics, the system can be a warehouse, a transportation network, a yard, or the end-to-end flow from suppliers to customers. Unlike a static diagram, the model updates as orders, inventories, and schedules change. Teams can ask “what if” questions, compare options, and choose actions with a higher probability of meeting cost and service goals. This is the core value of Digital Twins in Logistics.
Core elements
- Structure: sites, docks, doors, lanes, fleets, storage locations, process rates, constraints
- Data feeds: WMS/TMS/ERP/OMS events, telematics/IoT signals, demand forecasts, rate cards
- Engines: simulation for flow and congestion, optimisation for routing and staffing, forecasting for demand and arrivals
How is a twin different from a dashboard?
Dashboards describe what happened and what is happening. A twin estimates what is likely to happen if a specific action is taken.
- Dashboards monitor KPIs such as dwell time, on-time-in-full, and cost per order.
- Digital Twins in Logistics run controlled experiments, for example shifting inbound labour by two hours and estimating queue length changes.
Both are useful. Dashboards inform; twins prescribe.
Why consider Digital Twins in Logistics in 2025?
Several trends make adoption practical:
- Better data availability from WMS/TMS and telematics, with standard time stamps and events
- Lower computing cost, so scenario runs complete in minutes
- More frequent planning cycles, which create a natural cadence for running scenarios
These trends lower barriers while expectations for visibility and reliability continue to rise.
Where do the benefits usually appear?
Below are seven areas where Digital Twins in Logistics produce measurable results. Each section states the problem, the twin’s role, and evidence used to evaluate impact.
1) Network design and re-routing: can the same volume move with fewer miles?
Problem: Network footprints grow outdated as demand shifts.
Twin’s role: Represent facilities, service regions, lanes, and service levels; simulate reassignments and carrier mixes.
Evidence: Total miles, transit time distribution, utilisation, expedites, and lane cost per order.
Practical note: Start with a few high-volume lanes before attempting a full redesign. This keeps risk low and learning high for Digital Twins in Logistics.
2) Warehouse slotting and flow: which layout supports faster, steadier picks?
Problem: Congestion and long travel paths reduce picks per hour.
Twin’s role: Model pick paths, storage locations, and SKU velocity; test ABC re-slotting, one-way aisles, wave vs. waveless picking, and pack-out capacity.
Evidence: Travel time per line, queue length at pack, lines per labour hour, and variability across shifts.
Practical note: Re-slot a small group of A-SKUs to demonstrate value before broader changes.
3) Equipment and fleet maintenance: can planned work prevent avoidable downtime?

Problem: Unplanned stops at bottleneck equipment cause ripple effects.
Twin’s role: Combine usage patterns and failure curves to schedule maintenance windows and prepare spare parts.
Evidence: Expected throughput with different maintenance policies, emergency stops avoided, service level impact, and spare parts turns.
Practical note: Focus on assets whose downtime blocks critical flows, such as inbound sorters or high-reach trucks. This aligns with the preventive focus of Digital Twins in Logistics.
4) Labour planning and shift design: what schedule meets SLA with minimal overtime?
Problem: Over-staffing raises cost; under-staffing creates backlog.
Twin’s role: Blend forecast orders with process rates to plan hours and skills by time of day.
Evidence: Throughput vs. backlog curves, overtime hours, and queue stability.
Practical note: Cross-training scenarios often reveal small skill shifts that stabilise peaks.
5) Inventory placement and safety stock: where should stock sit to balance service and cost?
Problem: Excess inventory ties up capital; low inventory risks stockouts.
Twin’s role: Test multi-echelon policies and positioning of fast movers closer to demand.
Evidence: Fill rate, days of supply, transfer frequency, and working capital under varying demand variance.
Practical note: Treat safety stock as a policy you can simulate, not a fixed number. This mindset fits the iterative nature of Digital Twins in Logistics.
6) Yard and dock orchestration: how do we reduce dwell and door conflicts?
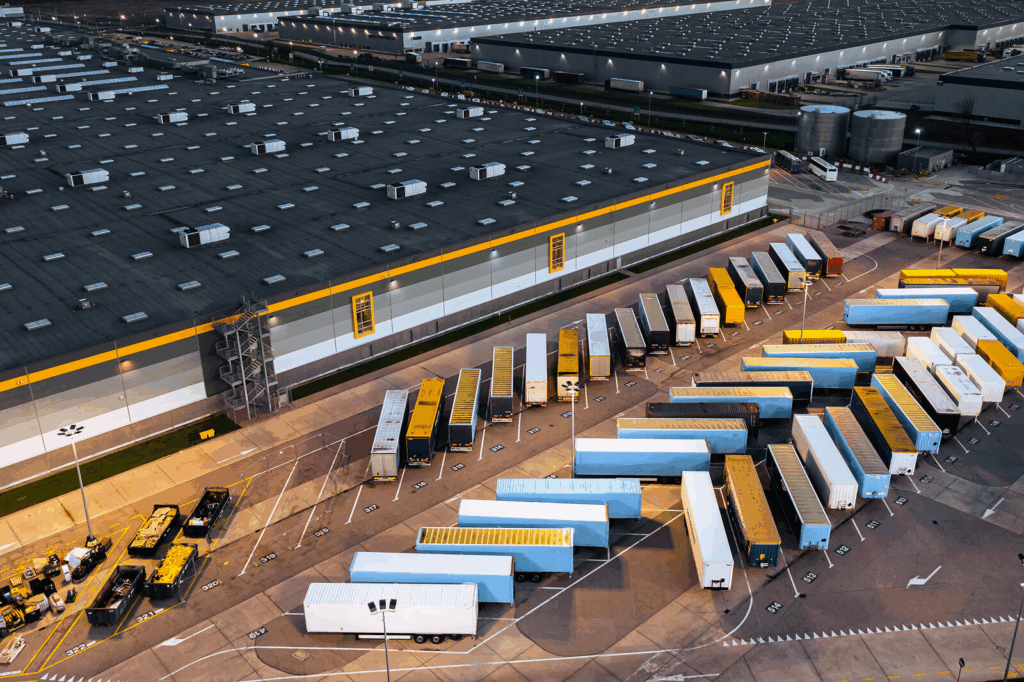
Problem: Arrival variability and limited doors cause queues.
Twin’s role: Simulate appointment windows, unloading rates, door zoning, and yard truck routing.
Evidence: Dwell time distribution, door utilisation, missed appointment rate, and yard move counts.
Practical note: Pilot one gate or one commodity family to validate assumptions quickly.
7) Risk and resilience: what breaks first under stress, and what is the least-cost workaround?
Problem: Weather events, strikes, or port slowdowns disrupt plans.
Twin’s role: Stress-test the network and store pre-approved playbooks such as alternate routings, surge capacity, and backup carriers.
Evidence: Cost-to-serve vs. service level trade-offs for each contingency.
Practical note: Keep playbooks in the twin so response time is minutes, not days. This operationalises Digital Twins in Logistics during disruption.
What data is required to begin?
Perfect data is not required; clarity about assumptions is. A minimal set includes:
- Topology: sites, docks, doors, yard capacity, lanes, transit times
- Rates: pick/pack rates, unload/load rates, travel speeds, equipment capacity
- Flows: historical orders and shipments for calibration
- Constraints: shift windows, carrier cut-offs, dock limits, fleet hours-of-service
- Targets: service levels, cost ceilings, penalties, and incentives
When data is sparse, document assumptions and run sensitivity tests to identify which inputs most affect conclusions in Digital Twins in Logistics.
How do we validate that the twin is credible?
Validation is continuous rather than a single hurdle:
- Reproduce a recent day or week within acceptable error bands.
- Perform sensitivity checks so outputs change logically when key inputs change.
- Run a limited rollout that reflects the chosen scenario and compare KPIs to baseline.
- Track forecast vs. outcome error and adjust parameters on a set cadence.
A trusted programme treats validation as routine quality control for Digital Twins in Logistics.
What technology stack is typical?

A pragmatic stack avoids unnecessary complexity:
- Systems of record: WMS, TMS, ERP, OMS, telematics/IoT
- Pipelines: scheduled ETL/ELT for bulk data; event hooks for critical signals such as gate arrival
- Engines: discrete-event simulation for flow, mathematical programming for routing and labour, and time-series models where they add clear value
- Interfaces: scenario setup forms, side-by-side comparisons, and exportable action plans that planners can apply
The emphasis is usability by operations teams, not continuous custom coding.
How should ROI be measured?
Tie each pilot to one measurable KPI:
- Transport: cost per shipment, on-time pickup/delivery
- Warehouse: picks per hour, lines per order, dock dwell
- Inventory: days of supply, stockouts, aged inventory
- Service: OTIF and promised-to-actual cycle time
Use a baseline period and a controlled implementation window. Report variance bands rather than a single point estimate to reflect normal volatility. This creates defensible results for Digital Twins in Logistics.
Conclusion: what value should you expect?
Digital Twins in Logistics provide a systematic way to test operational decisions before committing resources. The strongest results appear when teams use the twin regularly on focused questions, with transparent assumptions and clear follow-through. The advantage is faster, evidence-based iteration—choosing the next plan with more information than yesterday. Start with one concrete problem, keep the model simple, measure outcomes carefully, and improve over time.
Industry Insights
news via inbox
Nulla turp dis cursus. Integer liberos euismod pretium faucibua

